Know Your Best Trading Hours — Introducing Win Rate Analytics on Wicklog
Wicklog now breaks down your win rate overall, by selected trades, by duration, and hour by hour — so you can see exactly when you trade best.
Every trader knows their overall win rate. Very few know when that win rate is earned — and when it quietly bleeds away. With Wicklog's new win rate analytics, you can now slice your performance overall, across any duration, on hand-picked trades, and — our favourite — by the hour of the day.
Win Rate, Everywhere You Look
Your dashboard already gives you the big picture at a glance: net P&L, total trades, average win and loss, profit factor, max drawdown, and your overall win rate — all computed live from your connected broker trades.
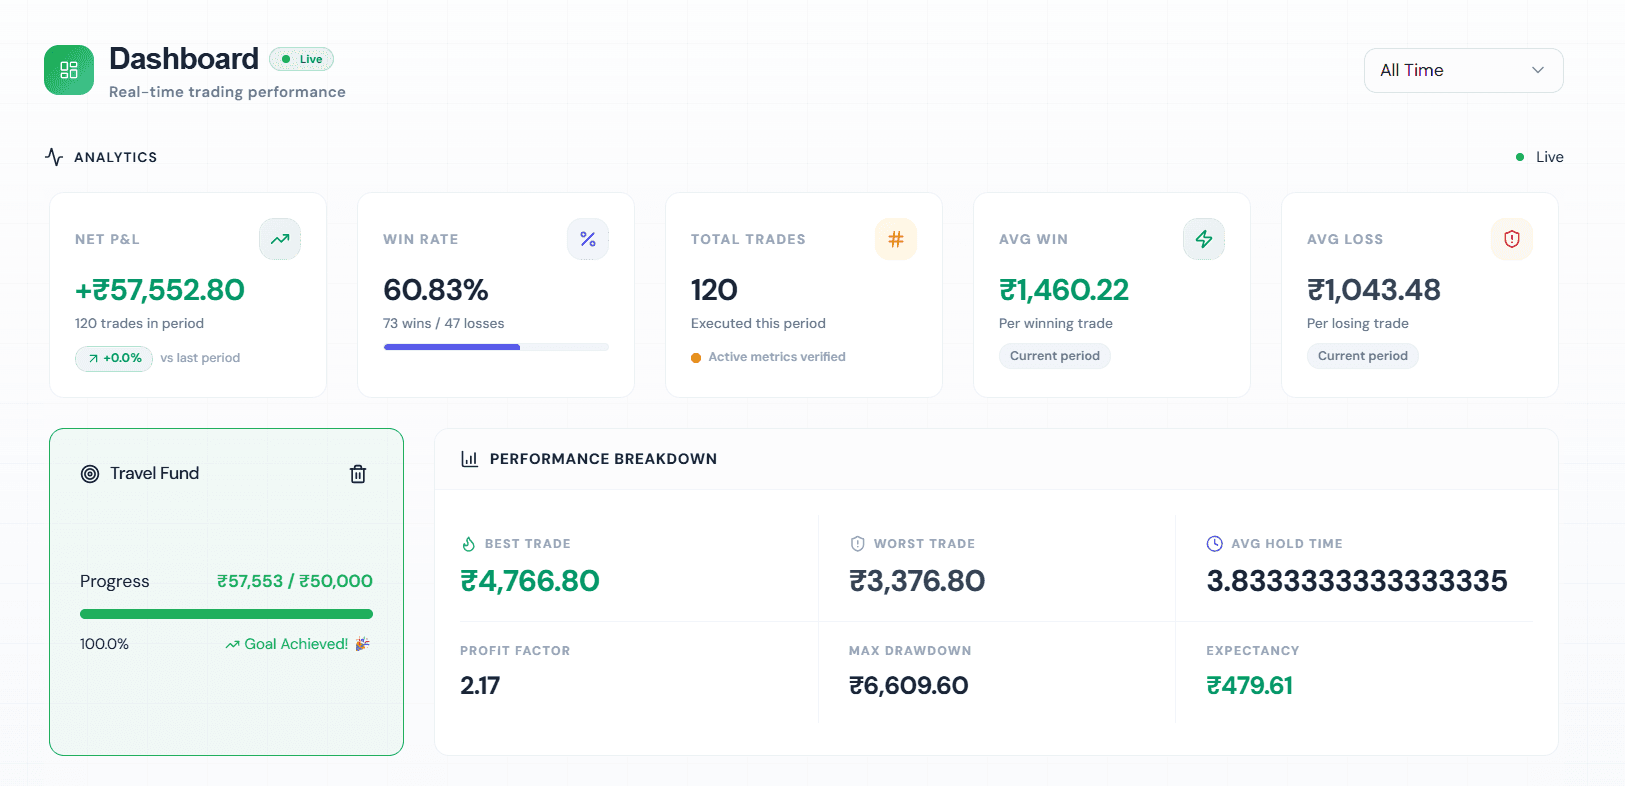 Wicklog dashboard showing overall win rate and performance breakdown
Switch the time filter from All Time to any duration and every metric recalculates instantly. Want to know if this month's win rate beats last quarter's? It's one click.
The Headline Feature: Win Rate by Hour
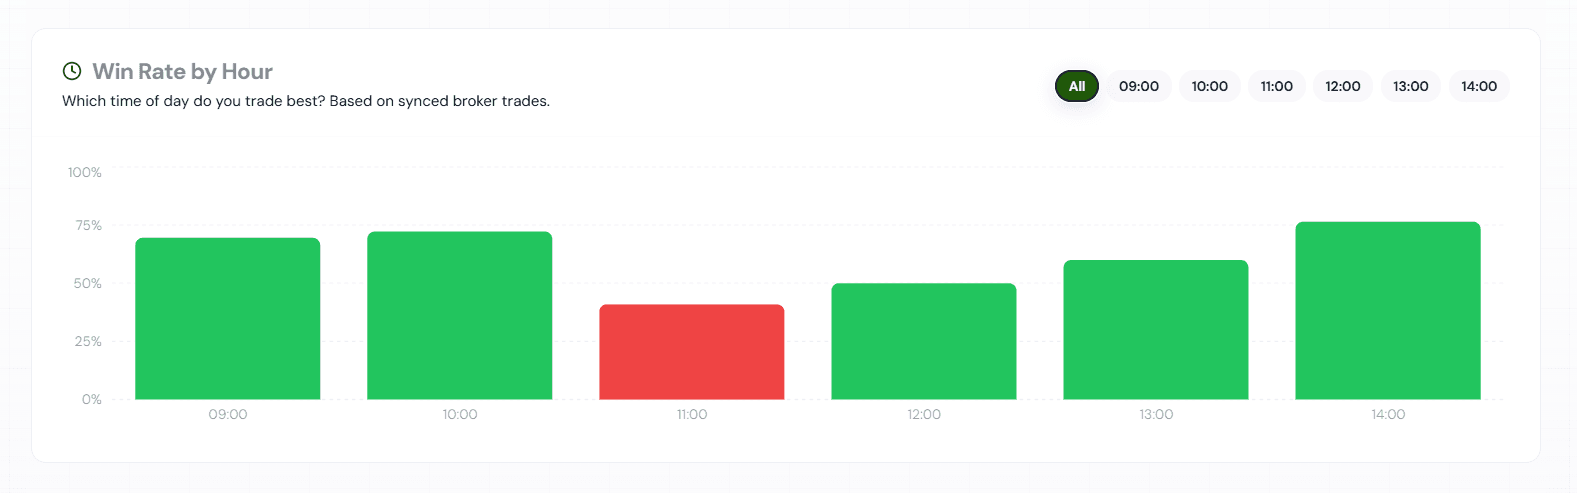
This is the one we're most excited about. The new Win Rate by Hour chart answers a question most journals can't: which time of day do you actually trade best?
 Win Rate by Hour chart showing performance across the trading day
Each bar is an hour of the trading session, built from your connected broker trades. Green bars are hours where you win more than you lose. Red bars are hours that are costing you money — and they're often invisible in your overall numbers.
Tap any hour to drill in. Here's a real example of what that looks like:
| Hour | Win Rate | Trades | Net P&L |
|---|---|---|---|
| 14:00 | 76.5% | 17 (13W/4L) | +₹9,218 |
| 11:00 | 40.9% | 22 (9W/13L) | −₹218 |
Same trader. Same strategies. Same markets. A 35-point win rate gap purely based on the hour of the day.
This trader's overall win rate is a healthy 60.83% — but that single number hides the fact that the 11:00 hour is a net loser across 22 trades, while the 14:00 hour is printing money. Cut the worst hour, size up the best one, and the equity curve changes without changing a single setup.
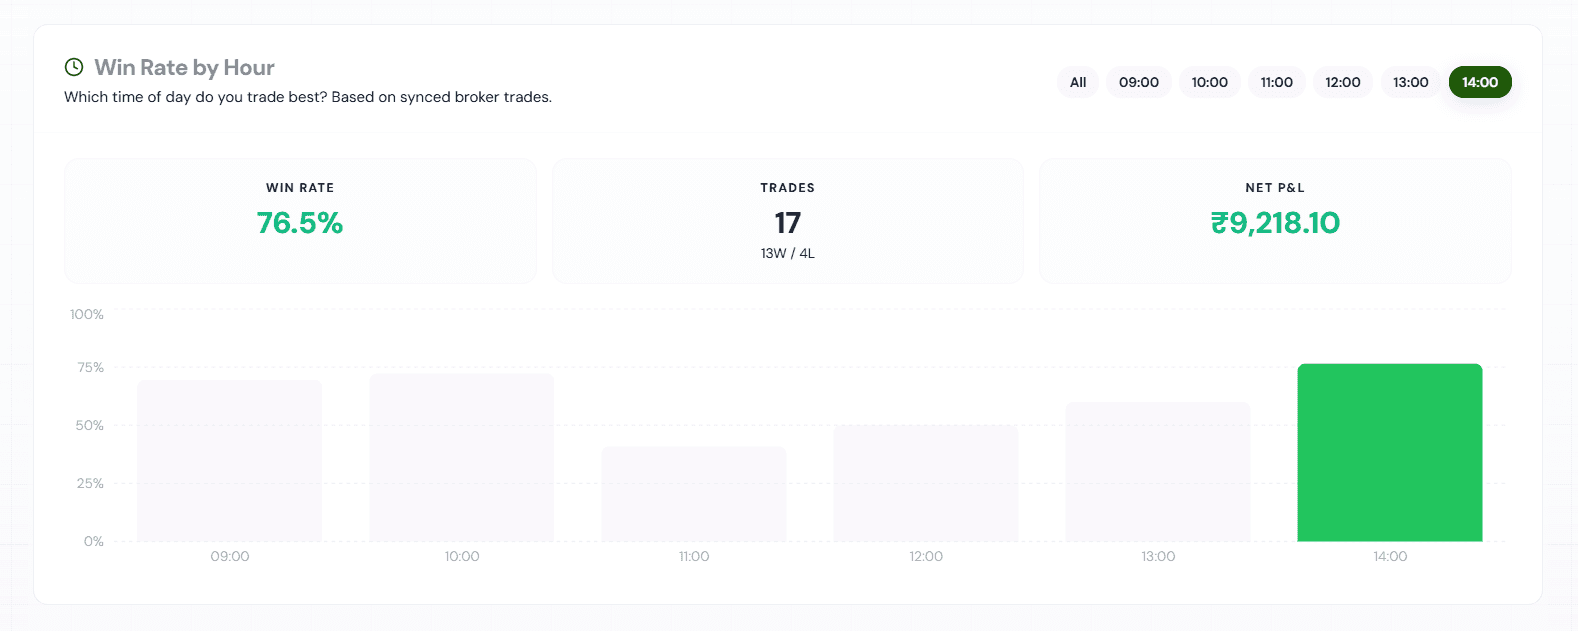 Drilled-in view of the 14:00 hour with 76.5% win rate
Analyze Any Trades You Select
Sometimes you don't want the full history — you want to interrogate a specific batch of trades. Maybe last week's breakout entries, or every short you took in August.
Select any trades from your trades screen and hit Analyze. Wicklog instantly generates a mini report for just that selection:
- Win rate and wins/losses
- Total P&L for the selection
- Average win vs average loss
- Largest win and largest loss
- Average holding days
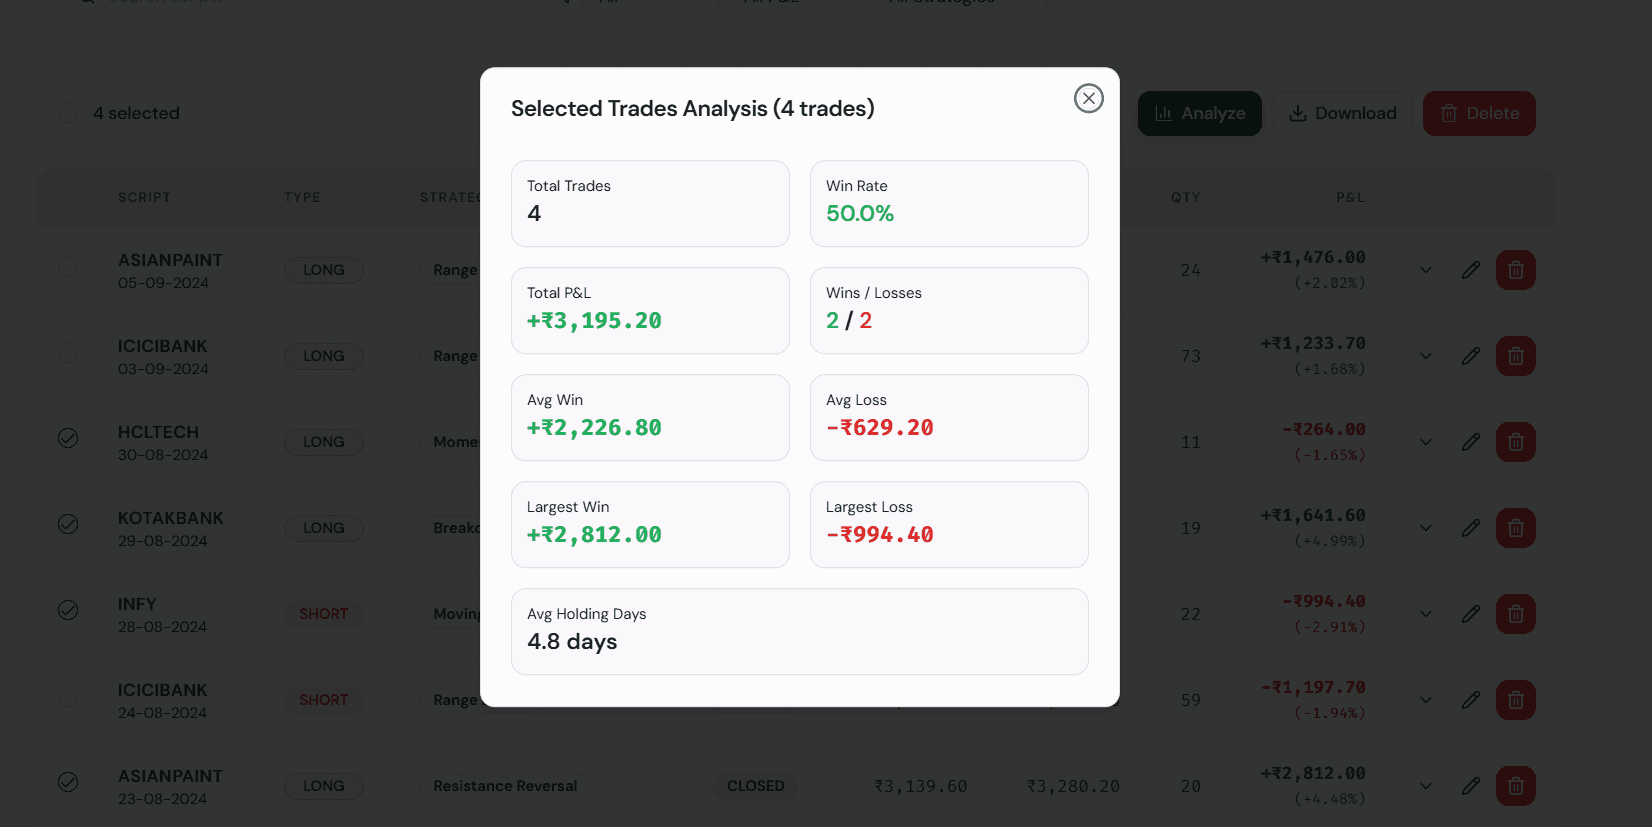 Selected trades analysis modal showing stats for 4 chosen trades
It's like running a backtest on your own real trades — no spreadsheets required.
Why This Matters
A trading journal that only records trades is a diary. A journal that shows you patterns is an edge. Time-of-day performance is one of the most consistent and most ignored patterns in retail trading — and now it's one click away.
Win rate analytics are live now on Wicklog. connect your broker, open the dashboard, and find out which hour is secretly your best — and which one to sit out.