Analytics dashboard
Every metric that matters,on one dashboard
Win rate, P&L calendar, equity curve, performance by hour and weekday, mistake patterns — WickLog turns your raw trade history into answers about where you actually make and lose money.
Free plan included · No credit card · Works with manual or imported trades
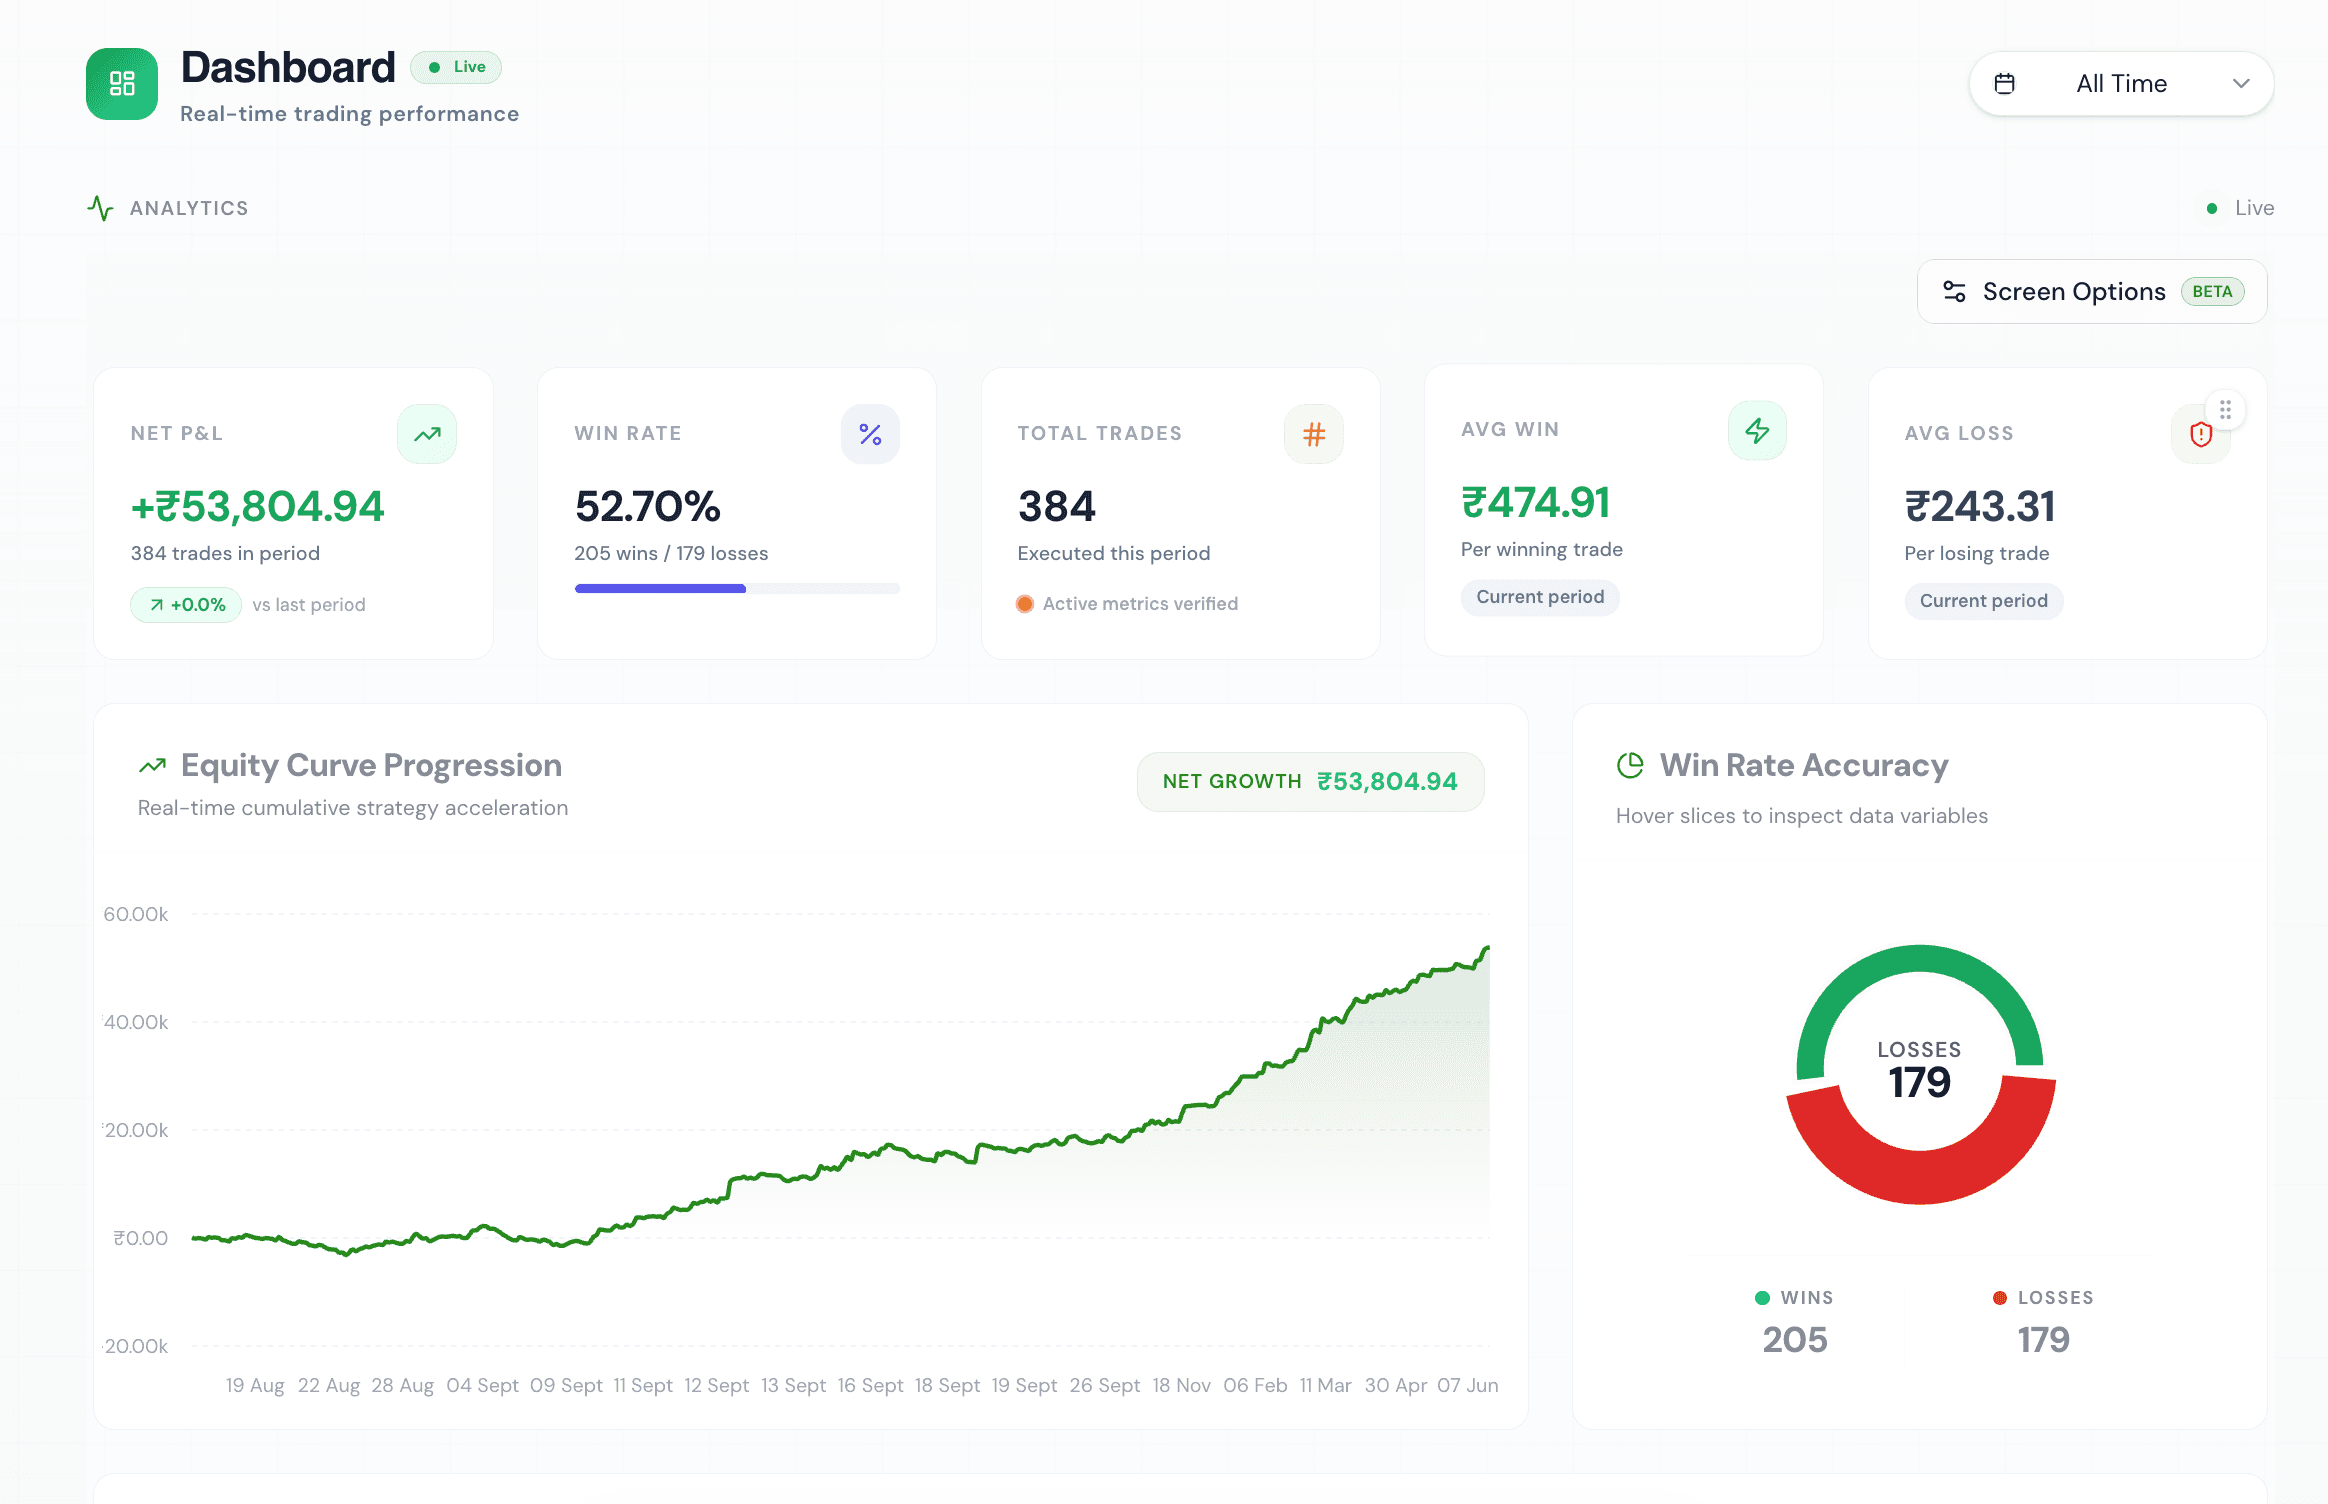
Know your edge, instantly
Most traders can tell you their last trade's P&L but not their win rate on Tuesday mornings, their average loss after a red day, or whether their Bank Nifty shorts actually make money. That gap between feeling and fact is where accounts bleed.
WickLog's analytics dashboard computes the facts from your actual trade history — imported from Zerodha, Dhan or Groww, or entered manually on the free plan. No formulas to maintain, no pivot tables, no lying to yourself.
KPI grid
Net P&L, win rate, average win and average loss — the four numbers that define your system, always current.
P&L calendar
A month-at-a-glance heatmap of green and red days. Spot overtrading weeks and revenge-trading clusters immediately.
Equity curve
Your account's story over time — is your system compounding, chopping sideways, or decaying?
Win rate by hour
See exactly which market hours help or hurt you. Built because a WickLog user asked for it — and it uncovered a hidden pattern in his trading.
Mistake patterns
Recurring errors surfaced from your journal and trades, so the same leak doesn't drain you twice.
Strategy radar & Trading DNA
Compare setups against each other and see the shape of your trading style at a glance.
A dashboard you arrange, not adapt to
Every widget on the WickLog dashboard is draggable — arrange the KPI grid, monthly P&L bars, win/loss pie, performance breakdown, charges summary and trading goals in whatever layout matches how you review. Your layout is saved to your account.
The charges summary deserves a special mention for Indian traders: brokerage, taxes and fees are the silent killer of F&O returns. WickLog keeps gross and net P&L side by side, so you always know what you actually kept after costs.
Analytics that understand Indian markets
Generic journals treat every instrument like a US stock. WickLog is built for NSE and BSE: Nifty and Bank Nifty options with strikes and expiries, stock F&O with real lot sizes, intraday versus delivery — the analytics respect the way Indian traders actually trade.
And the dashboard is only half the loop. Your journal entries link your notes and setups to the trades behind them, and Ticker AI reads your full history to answer questions your charts raise — like why your win rate drops after two consecutive losses.
Frequently asked questions
Is the WickLog analytics dashboard free?
Yes. The analytics dashboard is included in the free plan, with manual entry of up to 50 trades a month. Pro (₹349/month or ₹2,250/year) adds automatic broker imports, unlimited entries and Ticker AI.
What metrics does the dashboard show?
Net P&L, win rate, average win/loss, a P&L calendar, equity curve, monthly P&L bars, win/loss distribution, win rate by hour, performance breakdowns, mistake patterns, strategy comparisons, trading goals and a charges summary — arranged in draggable widgets.
Does it work for F&O and options trading?
Yes — WickLog is built for Indian F&O. Nifty and Bank Nifty options, stock futures and options, intraday and delivery equity are all analysed with correct lot sizes and expiries.
Do I have to import trades from a broker to use analytics?
No. Manual trades power the same dashboard on the free plan. Connecting Zerodha, Dhan or Groww (Pro) just removes the typing and adds exact timestamps for time-of-day analytics.
Does the dashboard account for brokerage and charges?
Yes. The charges summary widget tracks brokerage and fees so you can compare gross and net P&L — essential for high-frequency F&O trading in India.
Can I see which hours of the day I trade best?
Yes — the win rate by hour widget breaks your performance down by market hour, one of the fastest ways to find (and cut) your worst trading windows.
Stop guessing. Start measuring.
Your next edge is already hiding in your trade history. WickLog's dashboard finds it — free.
Create your free accountFree forever plan · No credit card needed